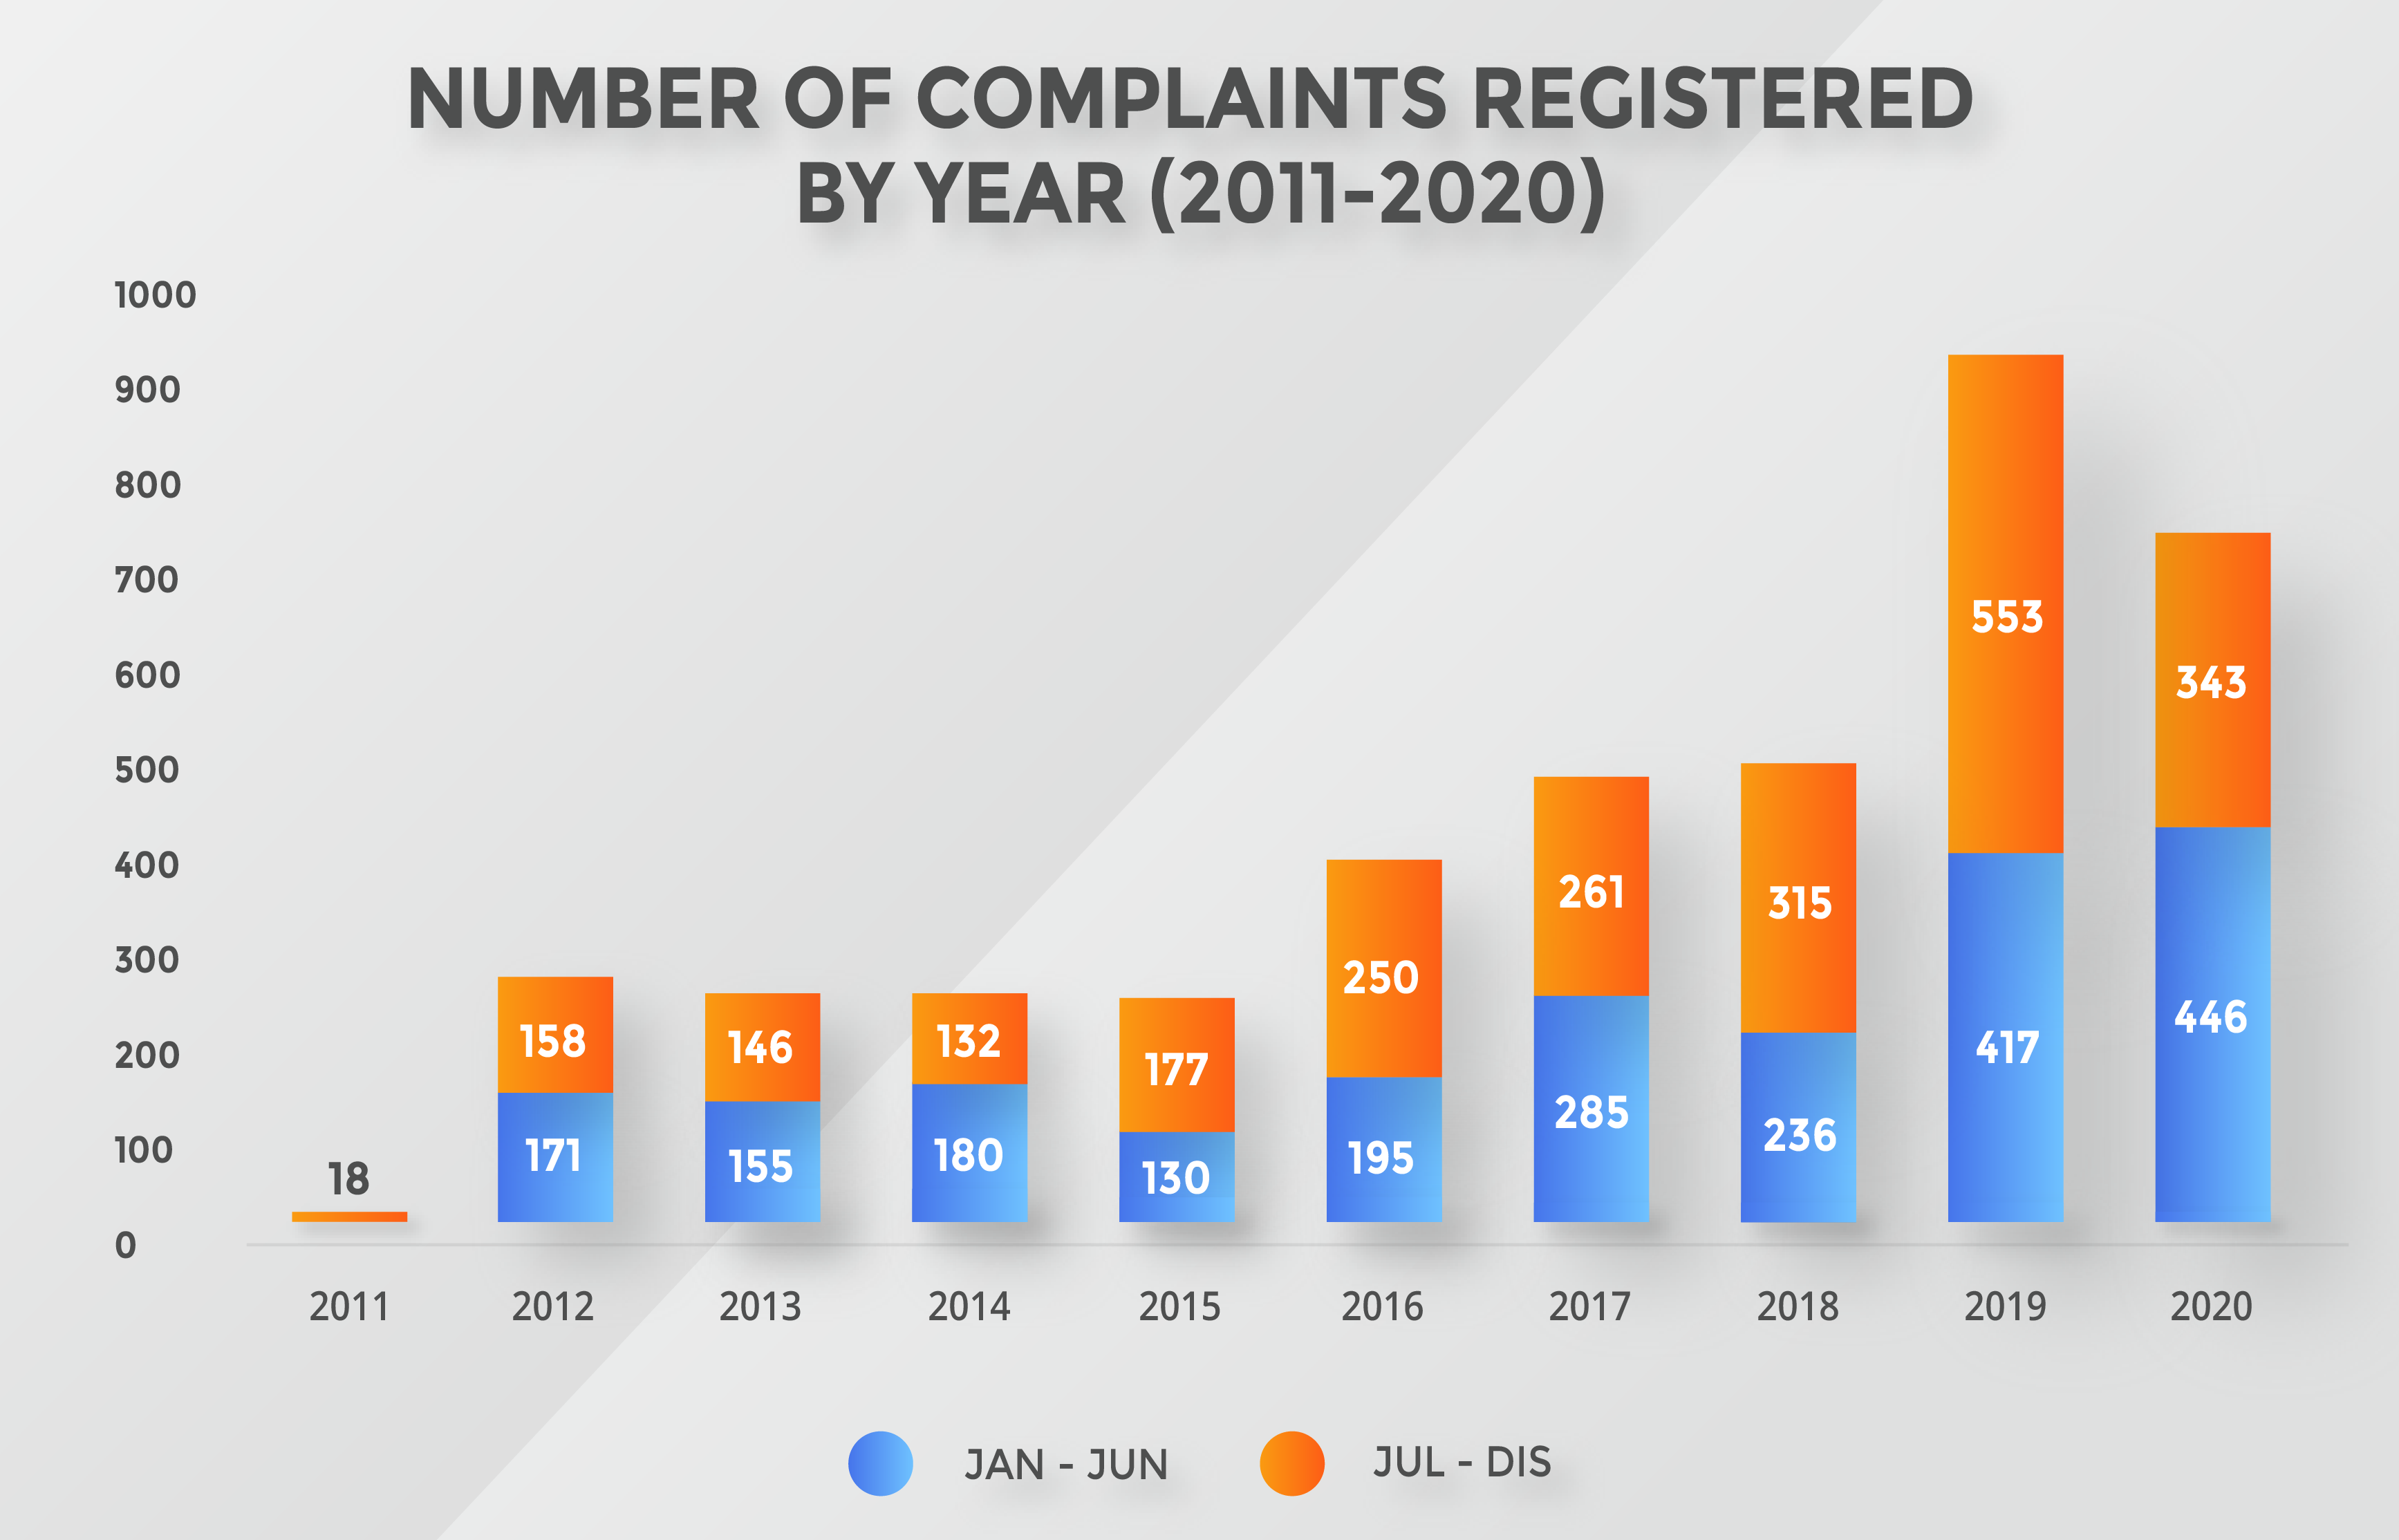
- Number of Complaints Registered by Year (2011-2020)
-
Number of Complaints Registered by Enforcement Agencies (2011-2020)
Number of Complaints Registered by Agencies
Agencies Year 2011 2012 2013 2014 2015 2016 2017 2018 2019 2020 TOTAL Royal Malaysia Police 17 253 215 222 219 306 440 477 742 699 3590 Immigration Department of Malaysia 0 17 15 16 17 27 20 38 57 61 268 Road Transport Department 0 12 10 11 9 12 13 9 28 37 141 Royal Customs Department of Malaysia 0 7 3 10 3 9 8 11 16 18 85 Ministry of Domestic Trades and Consumer Affairs 0 2 4 4 10 15 17 9 16 10 87 Ministry of Housing and Local Government 0 9 2 2 1 2 3 3 13 19 54 National Registration Department 0 4 1 3 5 3 7 11 9 12 55 National Anti-Drugs Agency 0 1 1 1 2 5 6 5 10 11 42 Labour Department 0 0 3 1 2 3 7 6 9 11 42 Volunteers Department of Malaysia (RELA) 0 1 0 1 5 1 1 1 3 7 20 Department of Environment 0 1 1 2 1 5 5 2 5 8 30 Ministry of Health 0 3 3 1 1 5 4 0 4 9 30 Malaysian Maritime Enforcement Agency 0 2 3 0 2 4 2 1 5 5 24 Department of Occupational Safety and Health 0 1 0 0 2 3 4 3 0 4 17 Ministry of Tourism, Arts and Culture 0 0 1 0 0 1 0 0 6 7 15 Industrial Relations Department 0 0 1 2 4 0 0 1 1 4 13 Department of Wildlife and National Parks 0 0 0 0 1 0 0 1 0 2 4 Fisheries Department 0 0 1 1 0 1 3 0 0 1 7 Registrar of Business 0 0 0 0 0 0 0 0 0 3 3 Civil Aviation Authority of Malaysia 0 0 0 0 1 0 1 0 0 1 3 Commercial Vehicles Licensing Board 0 0 0 0 0 0 0 0 0 2 2 Agencies Outside Jurisdiction 1 44 42 35 41 68 5 1 53 135 425 OVERALL TOTAL 18 357 306 312 326 470 546 579 977 1066 4957 NOTE :
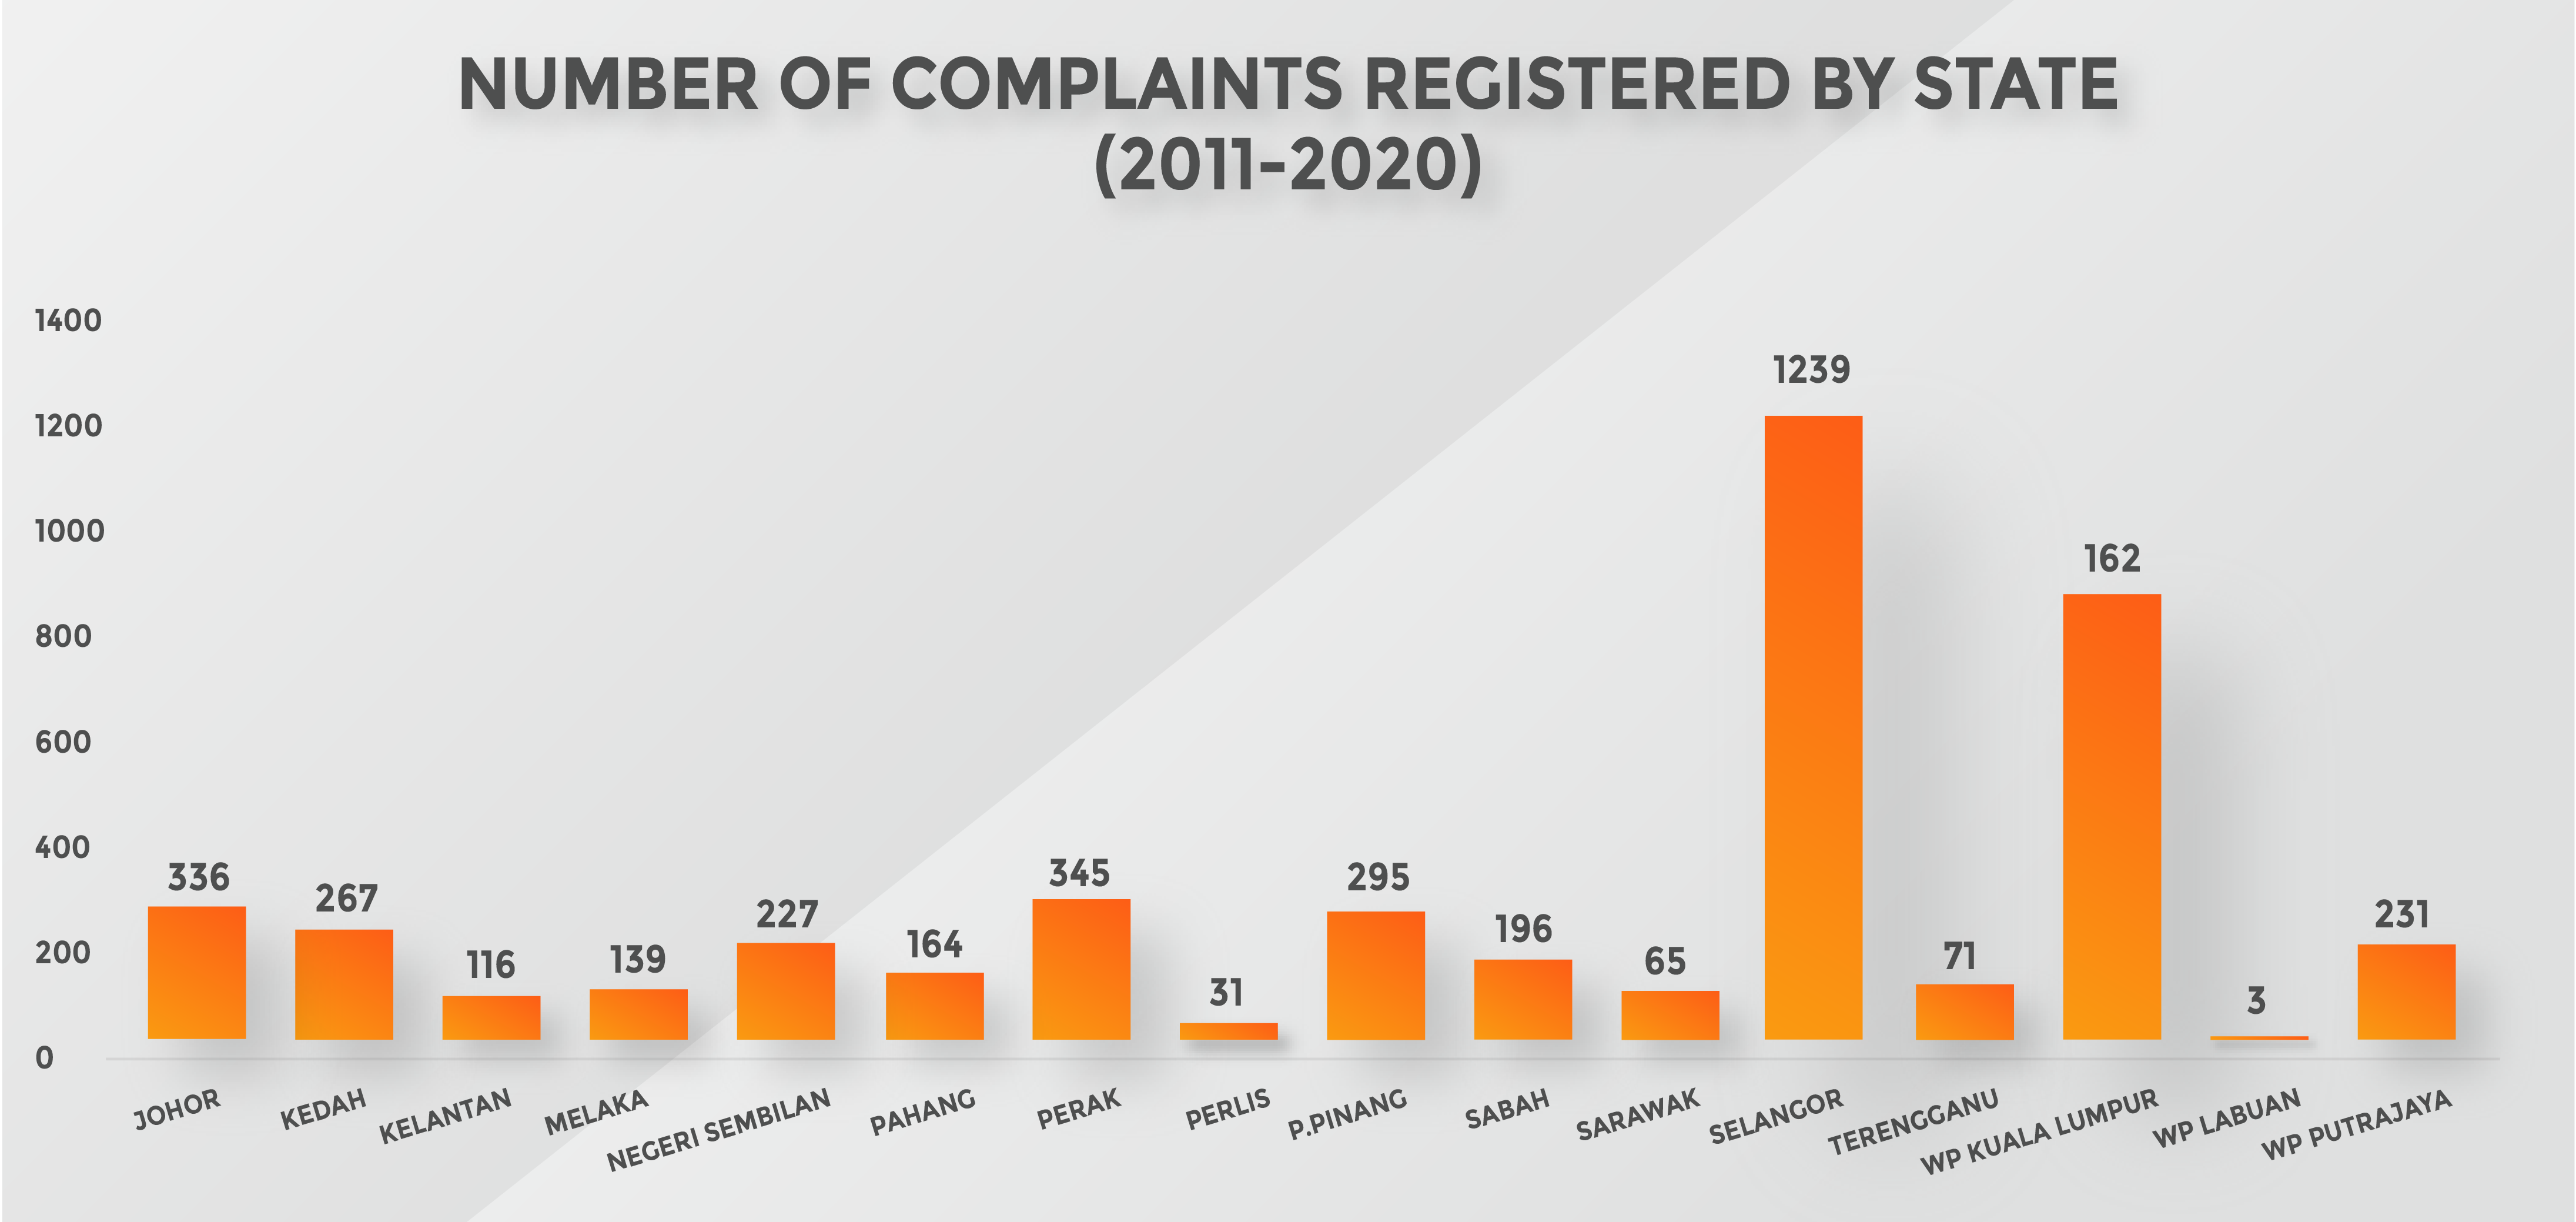
The total amount differs from the number of complaints registered because there are complaints involving complaints from more than one agency. - Number of Complaints Registered by State (2011-2020)
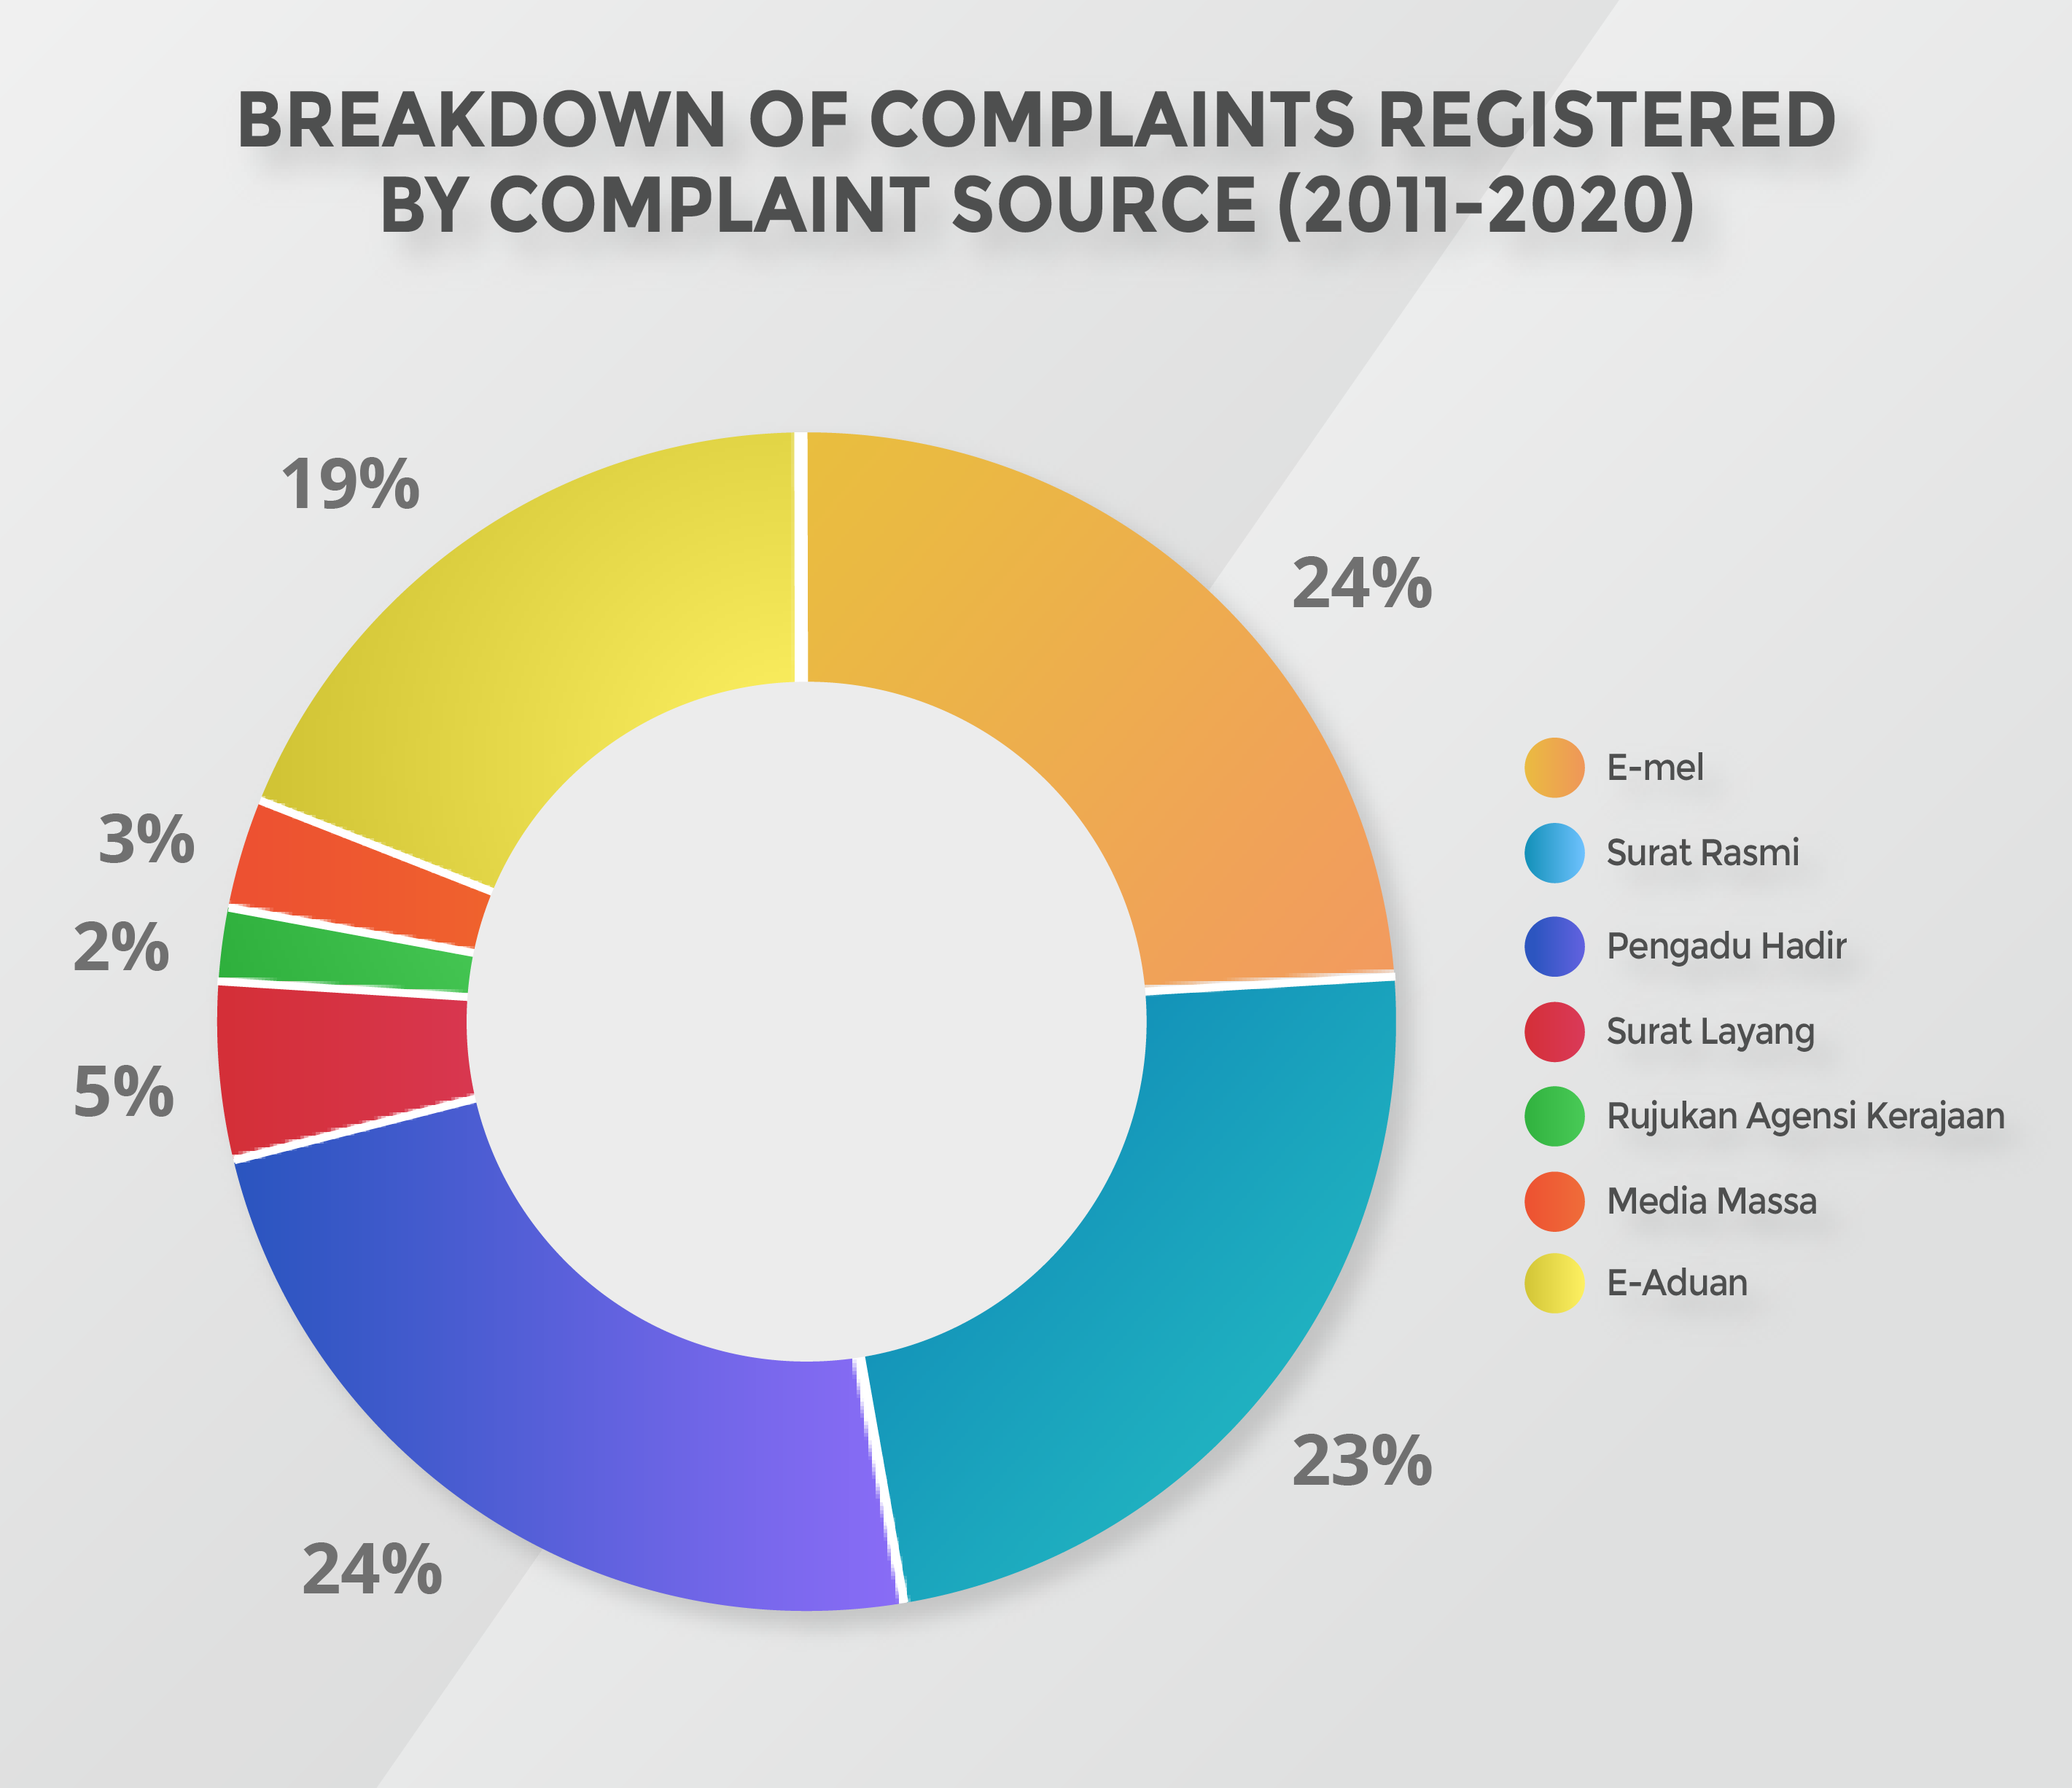
- Breakdown of Complaints Registered by Complaint Source (2011-2020)
Complaints
- Details
- 4605


